Introduction
The cup and handle pattern is a reliable bullish chart pattern that can signal significant price increases. However, spotting it on charts requires precision and practice. Whether you’re trading stocks, forex, or cryptocurrencies, knowing how to identify the cup and handle pattern is key to timing your trades effectively. This step-by-step guide explains how to recognize the pattern, confirm its validity, and avoid common pitfalls, making it easier for beginners and seasoned traders alike to master this powerful tool.
What is the Cup and Handle Pattern?
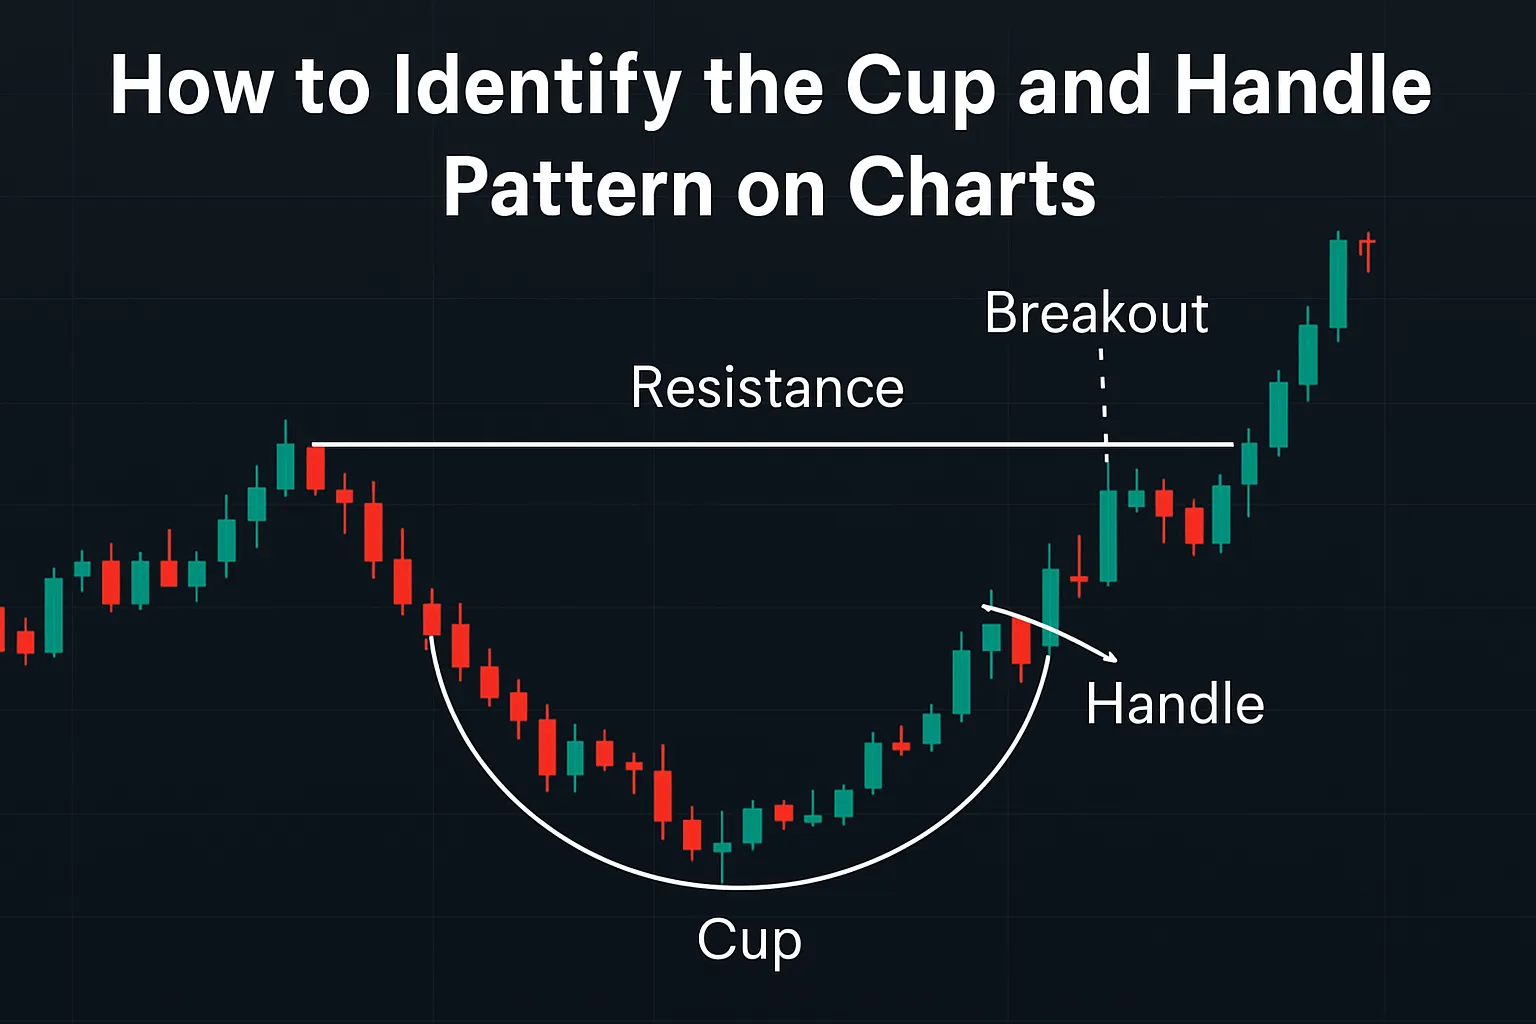
The cup and handle pattern is a bullish continuation chart pattern that forms after a price uptrend. It consists of two parts:
- Cup: A U-shaped consolidation, resembling a bowl, where the price dips and then recovers.
- Handle: A short, downward-sloping pullback that precedes a breakout.
The pattern signals that the price is likely to continue rising after breaking above the handle’s resistance. Identifying it correctly involves understanding its shape, duration, and volume characteristics.
Step-by-Step Guide to Identify the Cup and Handle Pattern
Follow these steps to spot the cup and handle pattern on price charts:
- Confirm a Prior Uptrend:
The pattern typically forms after a noticeable price increase (e.g., 10–20% or more). Look for a clear upward trend before the cup begins. - Spot the Cup Formation:
Identify a U-shaped price movement, not a sharp V-shape. The cup should have:- A rounded bottom, showing gradual accumulation.
- A depth of 20–30% from the peak to the trough.
- A duration of 1–6 months on daily or weekly charts.
- Locate the Handle:
After the cup, find a short consolidation period sloping downward slightly. The handle should:- Retrace 30–50% of the cup’s advance.
- Last 1–4 weeks.
- Show lower trading volume compared to the cup.
- Check Volume Patterns:
Volume is crucial for confirmation:- Volume often decreases during the handle’s formation.
- A breakout above the handle’s resistance should occur with a volume surge.
- Validate the Breakout:
The pattern is complete when the price closes above the handle’s resistance level (the cup’s peak). Ensure:- The breakout is on high volume.
- The price sustains above the resistance for confirmation.
- Use Charting Tools:
Platforms like TradingView or MetaTrader can help visualize the pattern. Draw trendlines to outline the cup’s U-shape and the handle’s downward slope.
For example, if a stock rises from $50 to $60, dips to $48 (forming the cup), returns to $60, and then pulls back to $57 (forming the handle), a breakout above $60 on high volume confirms the pattern.
Common Pitfalls to Avoid
- Mistaking V-Shapes for Cups: A sharp V-shaped dip is not a valid cup; it lacks the gradual accumulation phase.
- Ignoring Volume: Low volume on a breakout suggests a weak signal, increasing the risk of failure.
- Rushing the Handle: A handle shorter than a week may indicate insufficient consolidation.
- Overlooking Market Context: In a bearish market, even a well-formed pattern may fail.
Tools and Resources
To improve your ability to identify the cup and handle pattern:
- TradingView: A popular platform for charting and pattern recognition. Visit TradingView.
- Investopedia: Offers detailed explanations of chart patterns for deeper learning. Read more on Investopedia.
- StockCharts: Provides educational resources on technical analysis. Explore StockCharts.
Tips for Traders
- Practice on Historical Charts: Analyze past charts to build confidence in spotting the pattern.
- Use Multiple Time Frames: Check daily and weekly charts to confirm the pattern’s strength.
- Combine with Indicators: Pair with RSI or moving averages to validate breakouts.
- Stay Patient: Wait for a clear breakout before trading to avoid false signals.
FAQ
Q: How do I know if a cup and handle pattern is valid?
A: Ensure the cup is U-shaped, the handle slopes downward, and the breakout occurs with high volume.Q: What time frame is best for identifying the cup and handle pattern?
A: Daily or weekly charts are ideal, with the cup lasting 1–6 months and the handle 1–4 weeks.Q: Can beginners identify the cup and handle pattern?
A: Yes, with practice and charting tools like TradingView, beginners can learn to spot it easily.Q: What happens if the breakout fails?
A: A failed breakout may lead to a price drop. Use stop-losses below the handle to manage risk.Q: Is volume important for the cup and handle pattern?
A: Yes, low volume in the handle and high volume on the breakout confirm the pattern’s reliability.
Conclusion
Identifying the cup and handle pattern on charts is a valuable skill for traders seeking bullish opportunities. By following a clear process—confirming the uptrend, spotting the U-shaped cup, validating the handle, and checking volume—you can master this pattern. Avoid common mistakes and use tools like TradingView to enhance your accuracy. For more tips on the cup and handle pattern, explore https://cupandhandlepattern.com/.