Introduction
Using indicators for cup and handle trading can significantly improve your success rate. The cup and handle pattern is a reliable bullish signal, but pairing it with technical indicators enhances breakout confirmation and trade timing. Whether you’re trading stocks, forex, or cryptocurrencies, indicators add precision to your strategy. This guide explores the best indicators to combine with the cup and handle pattern, offering practical steps to optimize trades and reduce risks.
What is the Cup and Handle Pattern?
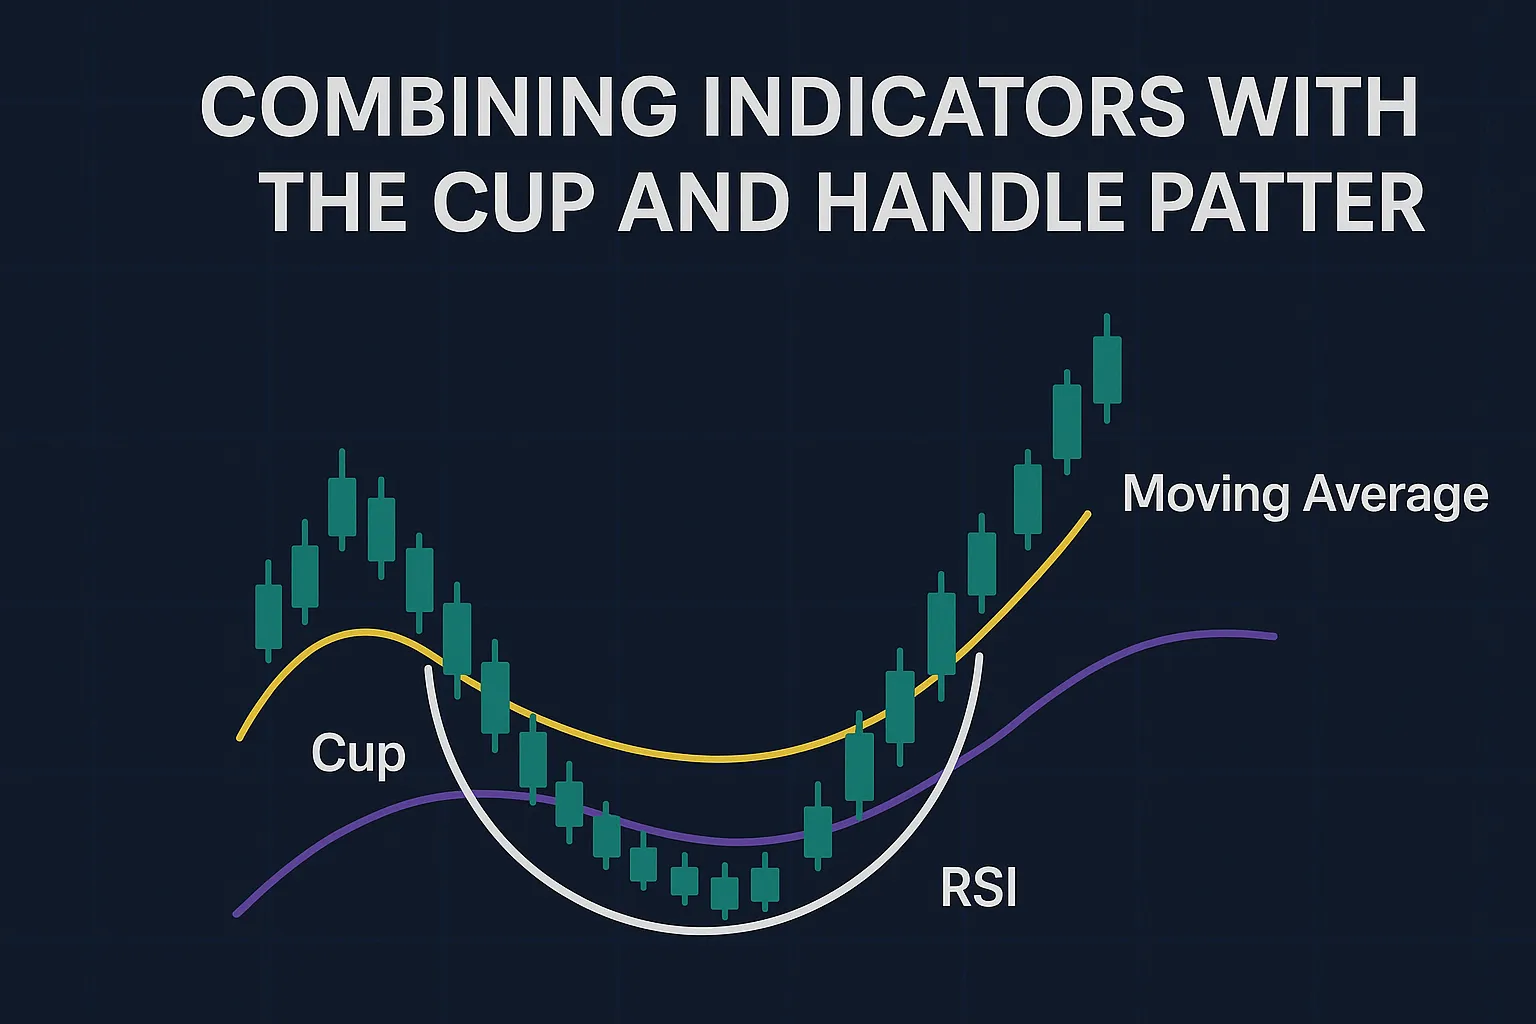
The cup and handle pattern is a bullish continuation chart pattern that forms after a price uptrend. It consists of:
- Cup: A U-shaped consolidation, resembling a bowl, lasting 1–6 months.
- Handle: A short, downward-sloping pullback, lasting 1–4 weeks.
The pattern signals a breakout when the price closes above the handle’s resistance with high volume. Indicators strengthen this signal by confirming momentum and trend direction.
Why Combine Indicators with the Cup and Handle Pattern?
Indicators for cup and handle trades provide:
- Breakout Confirmation: Validate the breakout’s strength to avoid false signals.
- Momentum Insights: Gauge whether the price has room to rise.
- Risk Reduction: Identify overbought conditions or weak trends early.
Using indicators ensures you trade with data-driven confidence, not just pattern recognition.
Top Indicators for Cup and Handle Trading
Combine these indicators to enhance your cup and handle strategy:
1. Relative Strength Index (RSI)
- Purpose: Measures momentum and overbought/oversold conditions.
- How to Use: Look for RSI between 40–60 during the handle, indicating healthy momentum. An RSI below 70 on breakout confirms the move isn’t overbought.
- Example: If RSI is 50 during the handle and rises to 65 on breakout, the trade has strong potential.
2. Moving Average Convergence Divergence (MACD)
- Purpose: Tracks trend direction and momentum.
- How to Use: A bullish MACD crossover (signal line above zero) during the breakout confirms upward momentum. Avoid trades if MACD shows divergence (e.g., price rises, but MACD falls).
- Example: A MACD crossover above zero on a breakout at $100 supports a buy signal.
3. Volume
- Purpose: Confirms buyer commitment.
- How to Use: Ensure low volume in the handle and a sharp spike on breakout. Use On-Balance Volume (OBV) to track cumulative volume trends.
- Example: A 50% volume increase on breakout validates the pattern’s strength.
4. Moving Averages (MA)
- Purpose: Identifies trend direction and support levels.
- How to Use: Confirm the price is above the 50-day or 200-day MA during the breakout. The handle often finds support near the 50-day MA.
- Example: If the price breaks out above $100 while above the 50-day MA, the trend is bullish.
5. Bollinger Bands
- Purpose: Measures volatility and breakout potential.
- How to Use: Look for the handle’s price to stay within or near the lower Bollinger Band, with a breakout pushing above the upper band.
- Example: A breakout above the upper Bollinger Band with high volume signals a strong move.
How to Combine Indicators Effectively
- Step 1: Start with volume to confirm the breakout (spike required).
- Step 2: Check RSI to ensure the breakout isn’t overbought (below 70).
- Step 3: Use MACD or moving averages to confirm trend strength.
- Step 4: Monitor Bollinger Bands for volatility and breakout confirmation.
- Step 5: Trade only when at least two indicators align with the breakout.
For example, if a stock breaks out at $50 with high volume, RSI at 60, and a MACD crossover, the trade is well-supported.
Common Mistakes When Using Indicators
- Overcomplicating: Using too many indicators can lead to conflicting signals.
- Ignoring Volume: Indicators are secondary to volume in confirming breakouts.
- Misreading Signals: Acting on weak indicator signals (e.g., RSI > 80) increases risk.
Tools and Resources
Refine your indicator use with these resources:
- TradingView: Analyze indicators alongside charts. Visit TradingView.
- Investopedia: Learn about technical indicators. Read on Investopedia.
- BabyPips: Explore indicator strategies for forex trading. Explore BabyPips.
Tips for Traders
- Test Combinations: Practice indicator setups on demo accounts.
- Focus on 2–3 Indicators: Avoid clutter by prioritizing volume, RSI, and MACD.
- Study Historical Charts: Analyze past breakouts to understand indicator signals.
- Stay Disciplined: Trade only when indicators and volume align.
FAQ Section
Q: What are the best indicators for cup and handle trading?
A: RSI, MACD, volume, moving averages, and Bollinger Bands are top choices for confirming breakouts.
Q: Why is volume the most important indicator for cup and handle?
A: Volume confirms breakout strength, with a spike signaling strong buyer commitment.
Q: Can RSI help avoid false cup and handle breakouts?
A: Yes, an RSI below 70 on breakout indicates the move isn’t overbought, reducing false signal risk.
Q: Do indicators for cup and handle work in crypto trading?
A: Yes, but crypto volatility requires careful indicator settings and volume confirmation.
Q: How many indicators should I use with the cup and handle pattern?
A: Use 2–3 indicators, like volume and RSI, to confirm signals without overcomplicating.
Conclusion
Combining indicators for cup and handle trading enhances your ability to spot reliable breakouts and time trades effectively. By using RSI, MACD, volume, moving averages, and Bollinger Bands, you can trade with precision in stocks, forex, and crypto. Test your strategy with tools like SAPRO and stay disciplined. For more trading insights, visit https://cupandhandlepattern.com/.