Introduction
The cup and handle pattern is a powerful tool in technical analysis, widely used by traders to predict bullish price movements. Named for its resemblance to a teacup with a handle, this chart pattern signals a potential continuation of an upward trend. Whether you’re a beginner or an experienced trader, understanding the cup and handle pattern can enhance your ability to spot profitable opportunities in stocks, forex, cryptocurrencies, and other markets. This comprehensive guide explains what the cup and handle pattern is, its structure, why it forms, and its significance in trading.
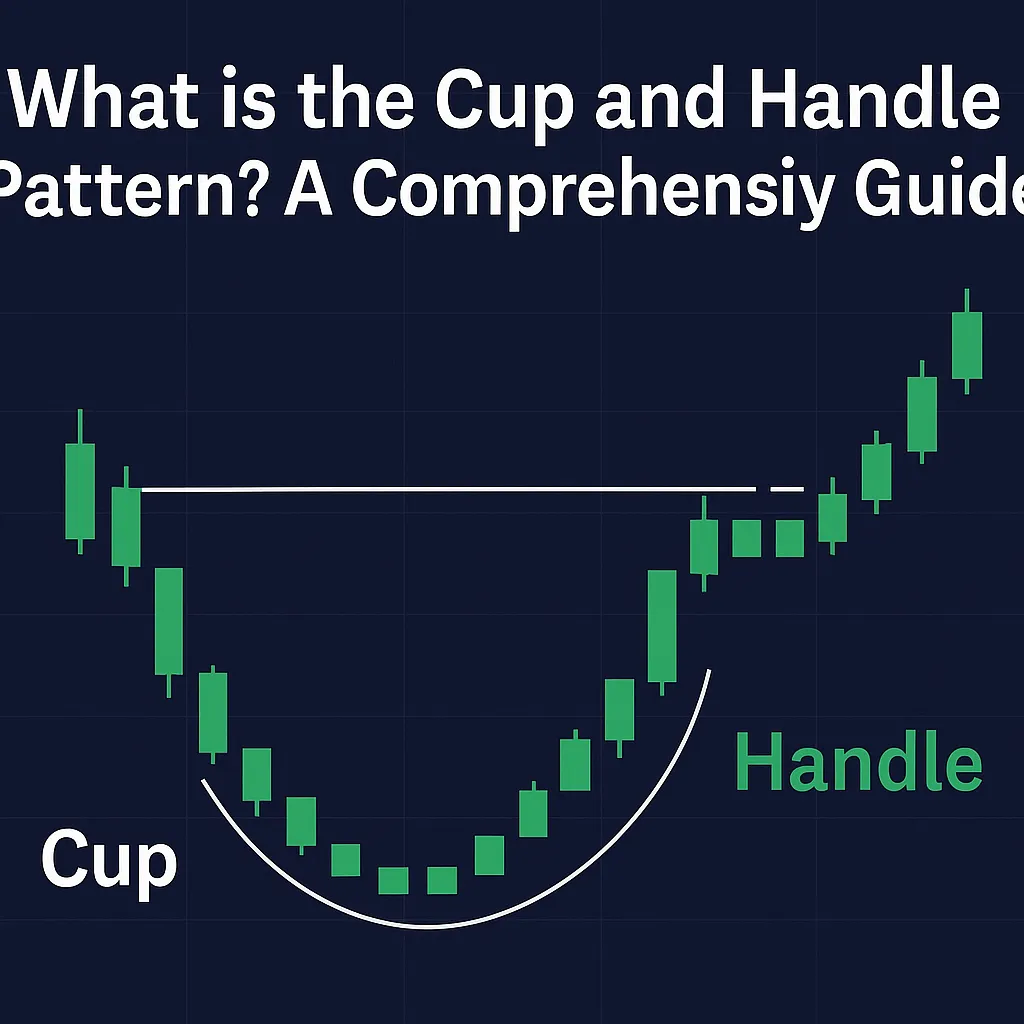
What is the Cup and Handle Pattern?
The cup and handle pattern is a bullish continuation pattern that typically forms after a significant price increase. It was popularized by William J. O’Neil in his 1988 book, How to Make Money in Stocks. The pattern consists of two main parts:
- The Cup: A U-shaped formation resembling a bowl or rounded bottom, indicating a period of consolidation and accumulation after a price rise.
- The Handle: A short-term consolidation or slight pullback, sloping downward, that forms after the cup, signaling the final preparation before a breakout.
The pattern is considered complete when the price breaks out above the handle’s resistance level, often accompanied by increased trading volume, suggesting a continuation of the prior uptrend.
Key Characteristics
- Shape: The cup should be smooth and U-shaped, not a sharp V-shape, indicating gradual accumulation.
- Duration: The cup typically spans 1 to 6 months, while the handle lasts 1 to 4 weeks, though these can vary by time frame.
- Depth: The cup’s lowest point is usually 20–30% below its peak, and the handle retraces about 30–50% of the cup’s advance.
- Volume: Volume often decreases during the handle formation and spikes during the breakout.
Why Does the Cup and Handle Pattern Form?
The cup and handle pattern reflects market psychology and trader behavior:
- Cup Formation: After a price rise, profit-taking leads to a gradual decline, forming the left side of the cup. As selling pressure subsides, buyers step in, pushing prices up to form the right side, indicating renewed bullish sentiment.
- Handle Formation: The handle represents a period of consolidation where weaker hands sell off, and strong buyers accumulate positions at slightly lower prices. The downward slope of the handle shows temporary hesitation before the breakout.
- Breakout: When the price breaks above the handle’s resistance, it signals that buyers have overcome selling pressure, driving the price higher.
This pattern is a visual representation of the market transitioning from accumulation to a new phase of upward momentum.
Significance in Trading
The cup and handle pattern is valued for its reliability in predicting bullish continuations. Its significance includes:
- High Probability: When properly identified, it often leads to significant price increases, making it a favorite among swing and position traders.
- Versatility: It works across various markets (stocks, forex, crypto) and time frames (daily, weekly, monthly).
- Clear Entry Points: The breakout above the handle provides a defined entry point, helping traders time their trades effectively.
However, like all technical patterns, it’s not foolproof. Confirmation with volume and other indicators, such as moving averages or RSI, is essential to reduce false signals.
How to Spot the Cup and Handle Pattern
To identify the cup and handle pattern on a price chart:
- Look for a Prior Uptrend: The pattern typically forms after a noticeable price increase.
- Identify the Cup: Find a U-shaped formation with a rounded bottom, where the price dips and then recovers to near its previous high.
- Check the Handle: After the cup, look for a short consolidation period with a downward slope, forming the handle.
- Confirm with Volume: Ensure volume decreases during the handle and increases during the breakout above the handle’s resistance.
- Validate Duration and Depth: Ensure the cup and handle align with typical durations (1–6 months for the cup, 1–4 weeks for the handle) and depth (20–30% for the cup, 30–50% for the handle).
Using charting tools like TradingView or MetaTrader can help visualize the pattern clearly.
Common Misconceptions
- It’s a Candlestick Pattern: The cup and handle is a chart pattern, not a candlestick pattern, spanning multiple candles over weeks or months.
- Always Bullish: While typically bullish, false breakouts or bearish variations (e.g., reverse cup and handle) can occur.
- Guaranteed Success: No pattern is 100% reliable; external factors like market news can disrupt outcomes.
Tips for Beginners
- Practice on Historical Charts: Use past price data to practice spotting the pattern before trading live.
- Use Multiple Time Frames: Check the pattern on daily and weekly charts to confirm its strength.
- Combine with Indicators: Pair the pattern with tools like volume, RSI, or MACD for better accuracy.
- Start Small: Test the pattern with small trades to build confidence.
FAQ
Q: Is the cup and handle pattern always bullish?
A: The standard cup and handle pattern is a bullish continuation pattern, signaling a likely price increase after a breakout. However, false breakouts or bearish variations, like the reverse cup and handle, can occur.
Q: How long does a cup and handle pattern take to form?
A: The cup typically takes 1 to 6 months to form, while the handle lasts 1 to 4 weeks. These durations can vary depending on the time frame (e.g., daily or weekly charts).
Q: Can the cup and handle pattern be used in all markets?
A: Yes, the pattern is versatile and can be applied to stocks, forex, cryptocurrencies, and commodities, across various time frames.
Q: What is the success rate of the cup and handle pattern?
A: Success rates vary, but studies suggest a 60–70% success rate for bullish breakouts when properly identified, though confirmation with volume and indicators is crucial.
Q: How do I know if the breakout is valid?
A: A valid breakout is typically accompanied by a surge in trading volume and a price close above the handle’s resistance level. Confirm with technical indicators for added reliability.
Conclusion
The cup and handle pattern is a cornerstone of technical analysis, offering traders a reliable way to identify bullish continuation opportunities. By understanding its structure, formation, and significance, you can enhance your trading strategy and make informed decisions. While not infallible, combining the pattern with volume analysis and other indicators increases its effectiveness. Stay tuned to https://cupandhandlepattern.com/ for more insights on mastering this powerful pattern.