Introduction
The cup and handle pattern is a powerful tool for traders, but confusion often arises about its nature. Is it a candlestick pattern like the doji or hammer, or something else entirely? This guide clears up misconceptions, explaining why the cup and handle is a chart pattern, not a candlestick pattern. By understanding its true classification, traders can better apply it in stocks, forex, and crypto markets. Let’s dive into the details and set the record straight.
What is the Cup and Handle Pattern?
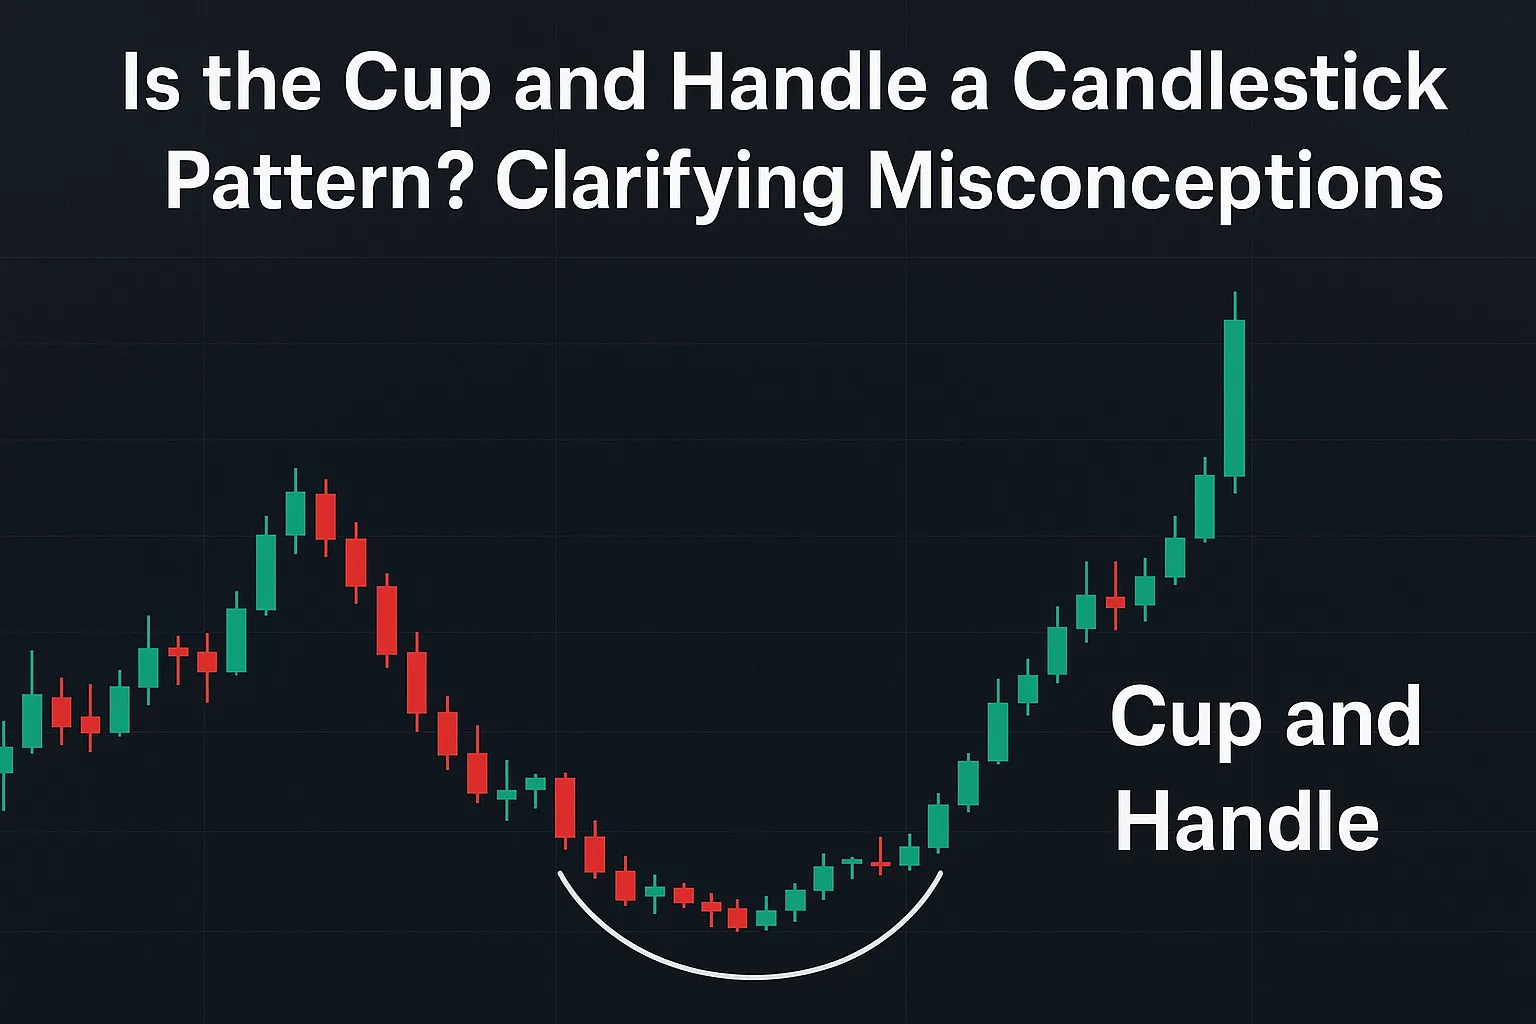
The cup and handle pattern is a bullish continuation chart pattern used in technical analysis to predict price increases. It forms over weeks to months and consists of two parts:
- Cup: A U-shaped consolidation resembling a bowl, showing a price dip and recovery.
- Handle: A short downward-sloping pullback, signaling a pause before a breakout.
The pattern completes when the price breaks above the handle’s resistance, often with high volume, indicating a likely continuation of the prior uptrend. Unlike candlestick patterns, which focus on single or small groups of candles, the cup and handle spans multiple candles across a larger time frame.
Candlestick Patterns vs. Chart Patterns
To clarify the misconception, let’s compare the two types of patterns:
Candlestick Patterns
- Definition: Formations created by one or a few candlesticks (e.g., doji, hammer, engulfing).
- Time Frame: Short-term, often covering 1–3 candles (minutes to days).
- Focus: Reflect immediate price action and trader sentiment.
- Examples: Bullish engulfing, shooting star, morning star.
Chart Patterns
- Definition: Larger formations on price charts, involving many candles (e.g., cup and handle, head and shoulders).
- Time Frame: Long-term, spanning weeks, months, or years.
- Focus: Indicate broader market trends and phases like accumulation or distribution.
- Examples: Double top, triangle, cup and handle.
The cup and handle is a chart pattern because it forms over an extended period, capturing a market’s consolidation and breakout phases, not just short-term candle behavior.
Why the Confusion?
The misconception that the cup and handle is a candlestick pattern stems from:
- Visual Similarity: The cup’s rounded bottom may resemble candlestick patterns like the rounded bottom reversal, leading to confusion.
- Terminology: Search terms like “cup and handle candlestick pattern” are common, as traders unfamiliar with technical analysis may use “candlestick” broadly.
- Charting Tools: Some platforms label all patterns under a “candlestick” category, blurring distinctions.
However, the cup and handle’s scale and structure clearly place it in the chart pattern category, as it reflects a longer-term market narrative, not a single candle’s story.
Why It Matters for Traders
Understanding that the cup and handle is a chart pattern helps traders:
- Set Realistic Expectations: Chart patterns like the cup and handle signal larger price moves, requiring patience compared to quick candlestick trades.
- Use Proper Analysis: Focus on volume, trend context, and time frames rather than candle-specific signals like wicks or bodies.
- Avoid Mistakes: Misinterpreting it as a candlestick pattern may lead to premature trades or incorrect setups.
For example, a trader expecting a cup and handle to resolve in a day (like a candlestick pattern) might miss its true potential, which unfolds over weeks.
How to Identify the Cup and Handle Pattern
To correctly spot the cup and handle as a chart pattern:
- Look for an Uptrend: The pattern typically follows a price increase.
- Find the Cup: Identify a U-shaped formation (not V-shaped) spanning 1–6 months.
- Spot the Handle: Look for a 1–4-week pullback sloping downward.
- Check Volume: Volume should dip during the handle and surge on breakout.
- Confirm Breakout: The price must close above the handle’s resistance.
Use tools like TradingView or MetaTrader to visualize the pattern over daily or weekly charts, ensuring you’re analyzing a chart pattern, not individual candles.
Tips for Beginners
- Learn Candlestick Basics: Understand candlestick patterns first to distinguish them from chart patterns.
- Practice on Charts: Study historical charts to recognize the cup and handle’s unique shape.
- Use Indicators: Combine with volume or RSI to confirm the pattern’s validity.
- Avoid Rushing: Be patient, as chart patterns take time to form and resolve.
FAQ
Q: Is the cup and handle a candlestick pattern?
A: No, it’s a chart pattern, forming over weeks to months, unlike candlestick patterns, which involve 1–3 candles.Q: Why do some call it a candlestick pattern?
A: Confusion arises from similar terminology or visual resemblance to patterns like rounded bottoms, but it’s a chart pattern.Q: Can candlestick patterns appear within a cup and handle?
A: Yes, candlestick patterns like doji or bullish engulfing may form during the handle, signaling breakout potential.Q: How long does a cup and handle pattern take to form?
A: The cup typically takes 1–6 months, and the handle 1–4 weeks, depending on the chart’s time frame.Q: Is the cup and handle reliable for trading?
A: Yes, when confirmed with volume and trend analysis, it’s a reliable bullish chart pattern, but false breakouts can occur.
Conclusion
The cup and handle is a chart pattern, not a candlestick pattern, despite common misconceptions. By recognizing its role as a bullish continuation pattern that forms over weeks or months, traders can use it effectively to spot profitable opportunities. Clear up the confusion, focus on its unique structure, and combine it with proper analysis for trading success. Visit https://cupandhandlepattern.com/ for more insights on mastering the cup and handle pattern.