Learn how to use volume to confirm cup and handle patterns for accurate trading signals in stocks, forex, and crypto.
Introduction
The cup and handle pattern is a trusted bullish chart pattern, but its reliability depends on proper confirmation. One of the most critical factors in validating this pattern is trading volume. Volume provides insight into market conviction, helping traders distinguish genuine breakouts from false signals. This guide explains how to use volume to confirm cup and handle patterns in stocks, forex, and cryptocurrencies, ensuring you trade with confidence and avoid costly mistakes.
What is the Cup and Handle Pattern?
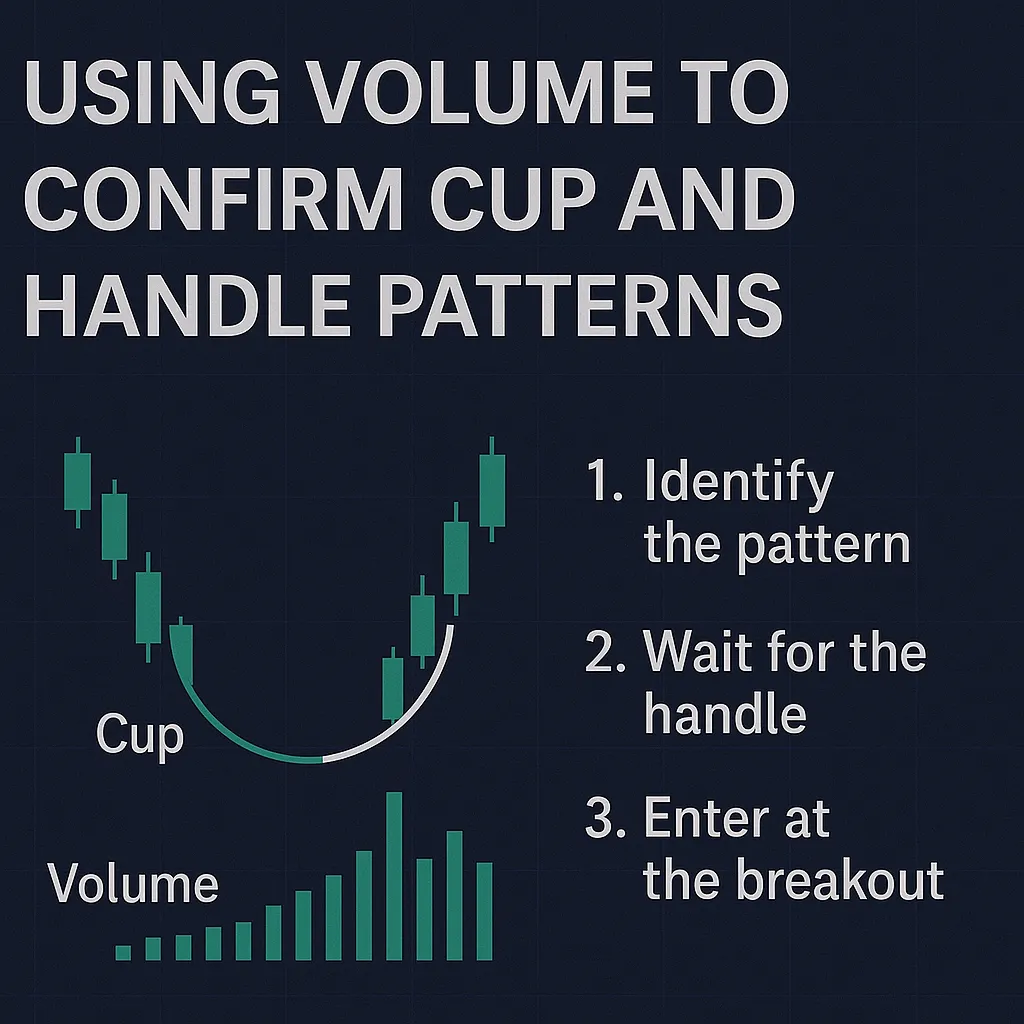
The cup and handle pattern is a bullish continuation chart pattern that signals a potential price increase after an uptrend. It consists of:
- Cup: A U-shaped consolidation, resembling a bowl, where the price dips and recovers over 1–6 months.
- Handle: A short, downward-sloping pullback, lasting 1–4 weeks, before a breakout.
The pattern is complete when the price breaks above the handle’s resistance, ideally with strong volume to confirm bullish momentum. Understanding volume’s role is essential for accurate identification.
Why Volume Matters in the Cup and Handle Pattern
Volume reflects the strength of buying and selling activity, acting as a confirmation tool for the cup and handle pattern. It helps traders:
- Validate Accumulation: Rising volume during the cup’s recovery shows strong buying interest.
- Confirm Consolidation: Low volume in the handle indicates reduced selling pressure, setting the stage for a breakout.
- Verify Breakouts: A volume spike during the breakout signals robust buyer commitment, increasing the pattern’s reliability.
Without proper volume patterns, the cup and handle may lead to false breakouts, costing traders time and money.
How to Use Volume to Confirm the Pattern
Follow these steps to analyze volume when identifying a cup and handle pattern:
- Check Volume in the Cup:
- During the cup’s left side (price decline), volume may be moderate as sellers exit.
- On the right side (price recovery), volume should increase, showing buyers stepping in. A steady rise in volume confirms accumulation.
- Monitor Volume in the Handle:
- Volume should decrease significantly during the handle’s formation. This low volume reflects a lack of aggressive selling, indicating consolidation.
- A handle with high volume may suggest instability or premature selling, weakening the pattern.
- Confirm the Breakout with Volume:
- The breakout above the handle’s resistance (the cup’s peak) must occur with a sharp volume spike. This surge shows strong buyer conviction.
- A breakout on low volume is a red flag, as it may indicate a false move likely to reverse.
- Use Volume Indicators:
- Tools like the Volume Oscillator or On-Balance Volume (OBV) can quantify volume trends. For example, a rising OBV during the cup’s recovery supports the pattern’s validity.
- Charting platforms like TradingView display volume bars below price charts, making it easy to spot trends.
For instance, if a stock forms a cup from $50 to $40 and back to $50, with rising volume on the recovery, then a handle at $48 with low volume, a breakout above $50 on a 50% volume increase confirms a strong pattern.
Common Volume-Related Mistakes
- Ignoring Low Volume Breakouts: A breakout without a volume spike often fails, as it lacks buyer support.
- Overlooking Handle Volume: High volume in the handle may signal weakness, not consolidation.
- Focusing Only on Price: Price movements alone don’t confirm the pattern; volume is equally critical.
Tools and Resources
Boost your volume analysis with these resources:
- TradingView: Visualize volume trends alongside price charts. Visit TradingView.
- Investopedia: Learn about volume indicators and their role in technical analysis. Read on Investopedia.
- StockCharts: Explore volume-based technical analysis techniques. Explore StockCharts.
Tips for Traders
- Compare Volume Trends: Use historical volume data to gauge whether current volume aligns with a valid pattern.
- Practice on Charts: Analyze past cup and handle patterns to understand volume’s role.
- Use Volume Indicators: Tools like OBV or Volume RSI can enhance confirmation.
- Stay Patient: Wait for a high-volume breakout before entering a trade to avoid false signals.
FAQ
Q: Why is volume important in the cup and handle pattern?
A: Volume confirms the pattern’s strength, with rising volume in the cup, low volume in the handle, and a spike on breakout.Q: What happens if a breakout has low volume?
A: Low-volume breakouts are often false, leading to price reversals. Always confirm with a volume surge.Q: How do I check volume in the cup and handle pattern?
A: Use charting tools like TradingView to monitor volume bars, ensuring low volume in the handle and a spike on breakout.Q: Can volume indicators help confirm the pattern?
A: Yes, indicators like On-Balance Volume (OBV) or Volume Oscillator can quantify volume trends for better confirmation.Q: Is volume more important than price in the cup and handle pattern?
A: Both are critical. Price defines the pattern’s shape, while volume confirms its bullish strength and breakout reliability.
Conclusion
Using volume to confirm cup and handle patterns is essential for accurate trading. By checking volume trends in the cup, handle, and breakout, traders can validate bullish signals and avoid false moves. Leverage tools like TradingView and indicators like OBV to enhance your analysis. For more tips on mastering the cup and handle pattern, visit https://cupandhandlepattern.com/.